In this guide, we’ll walk you through the fundamentals of linear regression.
Contents In The Article
Key Takeaways
- Linear regression is a statistical method for analyzing how an independent variable influences one or more dependent variables.
- Linear regression seeks the best line to fit the data points on a scatter plot diagram by minimizing the distance between points falling above or below the line.
- A regression line can be developed to interpolate or extrapolate data points within or beyond the original range.
- Linear regression has various applications in medicine, psychology, sociology, financial planning, and machine learning.
Linear regression is a statistical technique used to analyze the relationship between an independent variable X, and one or more dependent variables, usually Y. The method models the impact of changes in the independent variable on the dependent variable. For instance, it can be used to examine the influence of a person’s parents’ height (X) on their height ( Y).
Overall, we aim for this material to be both thought-provoking and informative.
Let us attempt to form a mental image of the concept at hand.
- Linear regression involves plotting data points on a coordinate system using dots to represent their values and aims to find a straight line that best fits the data (known as a scatter plot diagram).
- The linear regression analysis determines the most accurate line of fit for a set of points on a scatter plot diagram.
- The optimal fit is achieved by a line that reduces the distance between points above or below the line.
- The line’s purpose is to represent the distance between the points, creating a central point around which the data points are distributed.
- The line is commonly called the regression line or line of regression.
Once a regression line is established, various ways exist to further develop it.
- A guide can provide additional data points within the original data range through interpolation.
- Extrapolation can extend the line to include points beyond the original range. However, this should be done cautiously as the pattern may not hold for data outside the actual range.
A regression line is used to create a model that demonstrates the influence of the dependent variable on the independent variable or variables with various applications.
- Extrapolating from a statistical sample can lead to conclusions about a population.
- The regression line can predict future behavior that aligns with its trend.
These general applications have various specific applications in any field that depends on data, including science and business.
- One area of study in the health field is examining the relationship between smoking and heart disease data.
- The study of genetics and its connection to depression is a topic within psychology.
- The relationship between educational level and income is a topic of study in sociology.
- The relationship between marketing performance and revenue is essential to financial planning.
- Machine learning involves predicting the probability that a user searching for one term is also interested in information related to another term.
Now, let’s examine a specific instance.
This is an example of linear regression.
- An example of linear regression can be seen in the study conducted by Sir Francis Galton, a 19th-century British scientist who analyzed the correlation between the heights of parents and their offspring to understand the impact of parental height on children’s size.
- Galton’s research showed that there is not always a direct correlation between parents’ height and their offspring. Children’s heights tend to converge towards an average size, regardless of their parent’s height.
- Galton discovered that children’s height tends to average around 68 1/4 inches, regardless of their parent’s height. Deviations from this average height occur randomly and follow a typical distribution pattern.
- The bell-shaped curve is a distribution pattern where the average value is at the peak and results larger or smaller than this value fall away from either side in descending frequency. The term “normal” was introduced by Pearson, a student of Galton who originally described his results as “regression toward the mean,” referring to values drifting toward the average.
- Galton’s study provided a mathematical model for representing average height and predicting the likelihood of a child’s height diverging from this average based on their parents’ height. This demonstrates how linear regression can be applied to actual and hypothetical situations to make predictions.
What Is The Origin Of The Term “Linear Regression”?
The term “linear regression” combines the concepts of linearity and regression.
- In this context, “linear” represents the statistical mean using a straight line based on a set of numbers.
- The term “regression” originates from a Latin phrase that means to “go back”, describing how the data points move away from the regression line.
The term “linear regression” is associated with the concept of points deviating from a straight line, which can be a helpful tool for comprehending the mathematical and graphical meaning of linear regression.
Can You Explain The Concept Of The Line Of Regression?
The line of regression is a mathematical concept that represents the most accurate linear equation between plotted data points and is commonly known as the regression line.
What Are Residuals?
The distance between each data point and the regression line is measured in linear regression analysis. This distance is called a residual and represents how much an actual value differs from the average value represented by the bar. A positive residual occurs when a point lies above the regression line, while a negative residual occurs when a point lies below it. A fact that falls on the line has no residual.
What Is The Definition Of Least Squares In Linear Regression?
To calculate the least-squares regression line for a linear regression model, one must minimize the sum of the squares of their residual values. This method avoids the need to take absolute values, simplifying the equation. Squaring the residual values also eliminates any negative numbers.
Can You Explain The Concept Of A Linear Regression Model?
Linear regression models are mathematical equations that represent the connection between an independent variable and one or more dependent variables. These models can be classified into three primary categories.
- Simple linear regression (SLR) models involve a single independent variable associated with one dependent variable.
- Multiple linear regression (MLR) models involve several independent variables connected to a single dependent variable.
- Multivariate linear regression (MVLR) models use multiple independent variables concerning multiple dependent variables.
We will be primarily discussing SLR, however, it is essential to note the existence of MLR and MVLR, which we will briefly touch upon. Let us further elaborate on these differences.
Simple Linear Regression Models
A simple linear regression model plots one independent variable against one dependent variable. This is represented by a straight line drawn through points on a scatter plot diagram. The equation for this line uses a variation on the slope-intercept formula, where Y = mX+ b is replaced with the simple linear regression formula.
The equation displays the relationship between Y, β0, β1, and ε.
In this formula:
- In regression analysis, β0 denotes the point at which the regression line intersects the Y-axis when the corresponding X value is 0.
- The value of β1 is calculated by measuring the residuals to determine the average slope of the line.
- The symbol ε accounts for discrepancies between observed and expected values.
In simplified versions of this equation, the Epsilon variable may be omitted, which shortens the equation.
The equation is Y equals beta zero plus beta one.
The equation Y = b + mX has the same meaning as Y = mX + b, but with the order of the right side reversed to place the intercept before the slope.
The equation Y equals b plus m multiplied by X.
This equation is commonly used in linear regression.
The equation Y equals a plus b times X.
Later on, we will discuss the practical applications of using this equation. Currently, the focus is on understanding the process of finding an equation for a straight line in a customized slope-intercept form.
Multiple Linear Regression Models
A multiple linear regression model shows the relationship between several independent variables and one dependent variable. This is done by plotting the variables on a coordinate system with three or more dimensions. For example, the graph would be in a 3D coordinate system if there were two independent variables. The goal is to find the best-fitting plane for the data. To do this mathematically, the simple regression line equation is expanded by adding multiple terms for the average line slopes.
Y equals beta zero plus beta one plus beta two plus epsilon.
Incorporating multiple variables into a linear regression equation can make its resolution increasingly complex, with matrices being the most appropriate tool to tackle such problems, which demand a higher level of mathematical competence.
Multiple linear regression models are utilized when multiple factors impact an outcome, and one desire to observe their combined effect or the difference in the outcome when one factor is eliminated. An example is examining the impact of diet and exercise on cardiovascular health compared to solely examining diet or exercise individually.
Multivariate Linear Regression Models
A multivariate linear regression model establishes a relationship between multiple independent variables and multiple dependent variables. In simple terms, the formula for linear regression is expanded to relate the average of multiple dependent variables to the standard of numerous intercept and slope values, along with various error factors. Matrices come into play when solving multivariate linear regression equations.
Multivariate linear regression models can be beneficial in cases where multiple variables impact multiple results. An instance of this is examining how marketing, sales, and customer service performance impact revenue and brand reputation.
Types Of Linear Regression
The last section covered the primary forms of linear regression.
- Simple linear regression: one independent variable, one dependent variable
- Multiple linear regression: multiple independent variables, one dependent variable
- Multivariate linear regression: multiple independent variables, multiple dependent variables
In addition, more complex variations of linear regression are designed to handle various scenarios.
- In general linear models, the dependent variables are vectors.
- The models utilized heteroscedasticity to account for variables with differing variances.
- Generalized linear models can be used for dependent variables that are bounded or discrete.
- “hierarchical linear models” or “multilevel regression” refers to a system of regressions arranged in a hierarchical structure.
- Errors-in-variables models account for inaccuracies in measurements of independent variables.
These applications demonstrate the utilization of fundamental concepts found in linear regression.
Assumptions Of Linear Regression
Several vital assumptions must be met to accurately apply linear regression models, with four of the most significant being:
- In the context of data analysis, it is essential to note that the value of any other data point does not influence the value of any given data point.
- Linearity refers to approximating a straight line between dependent and independent variables.
- Homoscedasticity is a statistical term that indicates that the data points are equally dispersed around the regression line.
- The data exhibits a typical distribution pattern.
Now, let’s analyze the meaning of these.
Independent Observations
Linear regression assumes that observations are independent to ensure accurate results. If data points are influenced by each other, such as including a person twice or having identical quintuplets, the data is no longer independent. This was illustrated in Galton’s height study.
Linearity
Linear regression analysis assumes that the relationship between dependent and independent variables is linear. However, linear regression is not applicable when data deviates from a line. Alternative functions like exponential or logarithmic curves may better represent certain data sets.
Homoscedasticity
Homoscedasticity comes from Greek words that mean “scattered the same way.” This means that all values of X have the same residual variance. The opposite of homoscedasticity is heteroscedasticity. Heteroscedasticity makes it difficult for linear regression models to accurately represent variance.
Normality
The accuracy of slope and confidence intervals can be challenged when data residuals do not conform to a regular distribution pattern, which is assumed in normality.
Normality
Normality assumes that data residuals fall into a regular distribution pattern. When this is not the case, slope, and confidence intervals can be challenging to determine accurately.
How to Validate Linear Regression Assumptions?
Specific procedures may test linear progression assumptions and address common issues. Here are some simplified solutions:
Validating Independent Observations
To determine if observations are independent, one can plot residuals against independent variables or row numbers and confirm no correlation pattern between consecutive errors regardless of value sorting. One can verify independence by plotting residuals against time or utilizing a Durbin-Watson test in time series analysis. Independence concerns in time series can be addressed by incorporating lags or other methods.
Validating Linearity
To check for linearity, it is recommended to visually examine a scatter plot of the data and search for a diagonal line among the points. If it is not present, there are potential solutions, such as utilizing a nonlinear transformation or introducing another independent variable that is a nonlinear function of an existing variable. There is also the possibility of overlooking an independent variable resulting in a linear pattern.
Validating Homoscedasticity
Homoscedasticity can be assessed by plotting residuals against predicted values and identifying residuals that increase relative to the value. To address this issue, options include a logarithmic transformation of the dependent variable, redefining the dependent variable using a rate, or applying weighted regression to each data point based on its variance.
Validating Normality
To determine normality, a quantile-quantile plot (Q-Q plot) can be utilized to compare different parts of the data distributions, or specific tests like the Shapiro-Wilk test can be used. If normality is not achieved, examining for any outliers that may be affecting the results is recommended. If no outliers are identified, a nonlinear transformation of independent or dependent variables can be performed.
Calculating Linear Regression
You can calculate linear regression by using the regression line formula introduced earlier:
Y = β0 + β1 + ε
This formula can be rewritten in various ways. Some simplified versions of the formula omit the Epsilon term. A common simplified version of the linear regression formula is:
Y = a + bX
Here a is the intercept, and b is the slope. The intercept can be calculated by using a subformula that uses summation notation to represent the sum of X values and Y values and operations on them:
A = [(Σy)( Σx2) – (Σx)( Σxy)] / [n(Σx2) – (Σx)2]
Here n is the number of values in the sample.
The slope can be calculated using the subformula:
B = [n(Σxy) – (Σx)( Σy)] / [n(Σx2) – (Σx)2]
An online regression line calculator can assist you with the process of finding your line of regression. You can enter your X and Y values into the calculator, which will apply the formula to generate your regression line. Suppose you have a large amount of data that needs to be entered, or you have specialized needs. In that case, you can use a program such as Excel to create a linear regression model or hire a specialist familiar with the R programming language designed for statistics applications.
Real-World Applications of Linear Regression
The practical implications of linear regression are vast, as it can be used to model real-world scenarios and extrapolate future behavior based on the trend of the regression line in various contexts. Linear regression is used in many fields, such as medicine, psychology, sociology, and machine learning, for data analytics and visualization.
For example, studying heart disease rates related to smoking behaviors or educational level relative to income levels. It also has applications in financial planning to determine how marketing performance relates to revenue.
Linear regression starts with graphing data points onto a scatter plot diagram which seeks to fit them into the best line possible that minimizes the distance between points falling above or below it. This line is known as the regression line or line of regression and serves to model how the dependent variable influences the independent variable or variables.
It can then be used for interpolation within the original data range or extrapolation beyond it; however, caution must be taken when predicting outside of an established range due to a lack of certainty that it will follow the same pattern.
In the 19th century British scientist Sir Francis Galton’s study concerning parental heights affecting their children’s size, he found regardless of parents’ heights, their offspring tended toward an average height of around 68 1/4 inches with deviations from this value randomly around that peak via a typical distribution pattern – thus illustrating linear regression could be used for modeling real scenarios and predicting outcomes consistently with trends represented by its regression line.
Common Mistakes and Misconceptions in Linear Regression
Many people make mistakes or have misconceptions about analyzing the relationship between one variable and another using linear regression. It is essential to understand these common issues to ensure that the results of your analysis are accurate.
The following are some of the most common mistakes and misconceptions associated with linear regression:
- Regression Misconceptions: People often assume that a good fit for data points on a graph implies a causal relationship between variables, but this is not necessarily true. It’s important to validate any assumptions you make by running additional tests and performing other validations.
- Linearity Validation: It is also essential to ensure a linear relationship between two variables before performing a linear regression analysis. This can be done by plotting the data points onto a scatter plot diagram and assessing whether or not they form a straight line.
- Homoscedasticity Validation: Another issue that should be considered when performing linear regression analysis is homoscedasticity, which refers to how equally distributed errors around the regression line are. If errors appear non-randomly distributed, it could indicate that something else might influence your results.
- Normality Validation: Data should also generally follow a typical distribution pattern before attempting to use linear regression analysis on them, otherwise, it may lead to inaccurate results. This can be tested using statistical methods such as the Kolmogorov-Smirnov or the Shapiro-Wilk test for normality.
- Least Squares: The least squares method helps minimize errors by finding an equation that minimizes the sum of squared residuals from each data point relative to their respective predicted values on the line of best fit; however, it should only be used if these assumptions are validated first as incorrect assumptions can lead to inaccurate predictions based on this method alone.
Therefore, it is essential when conducting linear regression analyses that all assumptions made about relationships between variables are tested thoroughly beforehand to avoid potential inaccuracies in results due solely to miscalculations caused by mistakes or misunderstandings related to linear regression techniques and methods.
Having identified such common issues, software tools for performing linear regression can now be explored further to better understand how best to utilize them in practice and apply them accurately within our research projects.
Software Tools for Performing Linear Regression
Software tools allow researchers to accurately apply linear regression techniques and explore their potential benefits. With the help of software, a researcher can create a regression model that best fits the data points using the least square method.
Simple linear regression is often done with spreadsheet programs like Microsoft Excel or Google Sheets. A programming language like Python may be used for more advanced models, such as multiple regression. Python programming offers an extensive library of functions for performing linear regressions and provides powerful visualization options that allow users to quickly gain insights into their results. In addition, many machine learning libraries are available to assist in developing predictive models based on linear regression algorithms.
Excel analysis also supports basic linear regression capabilities through its built-in functions and graphical representations, making it easy for anyone to run an analysis without needing additional software tools or knowledge in coding languages. However, as with any statistical technique, users need to understand the assumptions necessary to accurately interpret results before relying on them for decision-making.
Understanding the Limitations of Linear Regression
Understanding the limitations of statistical methods, such as linear regression, is critical to ensure results are interpreted accurately.
Linear regression is a powerful tool for analyzing data and predicting future outcomes based on that data; however, it can also be limited in its applications.
The limitations of linear regression depend on various factors including the amount of independent observations available, the type of model being used, and the experience level of the data analyst.
When working with linear regression models, data analysts must pay close attention to assumptions about their datasets to properly interpret results. These assumptions include linearity between variables, homoscedasticity (constant variance) across the dataset, normality distributions for error terms, and lack of multicollinearity (no correlation between independent variables).
Deviations from these assumptions can lead to inaccurate interpretations, which could have serious consequences depending on their use. Therefore it is essential that data analysts understand these assumptions before attempting any advanced analysis with linear regression models.
In addition to understanding these basic assumptions associated with using linear regression models, it’s essential for data analysts to recognize when other forms of analysis may be better suited for a given task or dataset.
For example, logistic regressions allow for binary outputs instead of continuous ones that traditional linear regressions produce, while non-linear models such as polynomial regressions allow more complex relationships between dependent and independent variables than simple straight lines do.
By recognizing when different types of models should be used instead or along with traditional forms like linear regressions, data analysts can increase accuracy and gain deeper insights into their datasets.
Advanced Topics in Linear Regression
Delving into advanced topics in linear regression can provide an opportunity to unlock hidden depths of data analysis and uncover previously undiscovered insights. Linear regression can be used for more complex data sets, such as:
- Multivariate regression looks at how multiple independent variables influence one or more dependent variables.
- Regression machine learning, where algorithms are used to analyze large datasets with hundreds or thousands of points.
- Simulation modeling uses linear regressions to create predictive models from a set of observations.
These methods allow us to gain additional insights beyond the traditional qualitative analysis by understanding the relationships between different variables and their effects on each other.
In addition, these techniques have become increasingly important in data science as our understanding of digital information grows. By leveraging linear regression techniques, we can gain powerful insights that would otherwise remain hidden within the complexity of big data sets. As such, it is an essential tool for anyone interested in gaining greater insight into their data-driven projects and research endeavors.
The Role of Linear Regression in Machine Learning
Machine learning has seen increasing adoption of linear regression techniques for analyzing large datasets, allowing data scientists to gain powerful insights and develop predictive models. Linear regression is an essential tool for machine learning as it helps identify relationships between independent and dependent variables. Data scientists can use linear regression models to infer outcomes from a given dataset by understanding these relationships.
Linear regression works by constructing a regression line based on assumptions about the underlying data, such as normality and homoscedasticity of distribution. This line is then used to predict values for unknown points in the dataset using either interpolation or extrapolation, depending on whether they exist within or outside the original range. To ensure accuracy, it is essential that any assumptions made are valid before building a model.
The use of linear regression in machine learning goes beyond just prediction since it can also be used for feature selection purposes; finding which features have enough influence on predicting an outcome or identifying unnecessary elements that do not contribute significantly towards understanding the data better. This is especially useful when dealing with datasets containing many features, which could lead to overfitting issues if all were included in a model without proper consideration. SARIMA modeling can also be utilized alongside linear regression to refine predictions when time series analysis is required.
Frequently Asked Questions
What is the most efficient method of finding the least-squares regression line?
Finding the least-squares regression line is best accomplished by minimizing the sum of the squares of the residuals. For example, in Sir Francis Galton’s study on height between parents and offspring, he discovered that regardless of parent’s size, offspring tended to average 68 1/4 inches. This could be modeled with a linear regression equation that minimized the distance between points above or below this average.
How is linear regression used to extrapolate from a sample to a population?
Linear regression can be used to extrapolate from a statistical sample to conclusions about a population by predicting future behavior consistent with the trend of the regression line. It models how the dependent variable influences the independent variables and provides insight into their relationships.
What is the difference between interpolation and extrapolation in linear regression?
Interpolation and extrapolation are both methods used in linear regression to predict future behavior. Interpolation fills data points within the original range, while extrapolation extends the line beyond the actual range. Both can be used to accurately model how one variable influences another, but extrapolation should be approached carefully as it may not always follow the same pattern.
How do you know when a linear regression model is accurate enough to predict?
A linear regression model is accurate enough to predict when the residuals are minimized, indicating that the data points closely follow the regression line. This means that the independent variable can be used to reliably predict changes in the dependent variables.
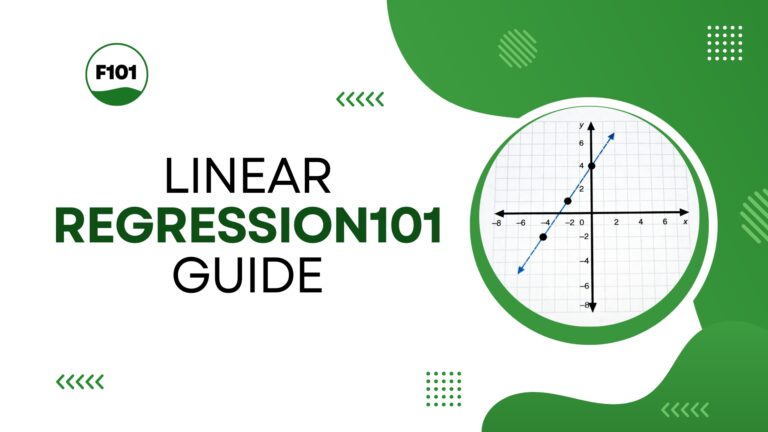
What is the best way to visualize linear regression data?
The best way to visualize linear regression data is by creating a scatter plot diagram, which plots the points onto a coordinate system and draws the best-fit line to minimize the distance between points. This line, known as the regression line or line of regression, provides an average for interpreting future data.
Find Linear Regression Support through Fiverr
Linear regression can be an effective technique for businesses to model and predict outcomes from financial planning to marketing results. This guide provides you with a basic understanding of linear regression, but your best strategy is to consult an expert to gain the most benefit.
Fiverr’s data analytics resources can put you in touch with experienced linear regression specialists who can handle the technical side, enabling you to focus on the business results you want. Try Fiverr today to find the perfect data analytics services for your business needs.
The formula for B is (n times the sum of xy minus the sum of x times the sum of y) divided by (n times the sum of x squared minus the square of the sum of x).
Conclusion
Linear regression is a powerful statistical tool that analyzes complex relationships between variables. It has been widely used for decades and is popular today, particularly in machine learning.
Despite its usefulness, it is essential to understand the limitations of linear regression and the common mistakes often made when using this technique. By considering these issues and being aware of advanced topics in linear regression, researchers can ensure they get the most out of their models.
To sum it up, having a firm grasp on linear regression is like having all your ducks in a row – it will help you get ahead with any data-driven task or project you may undertake.